Environmental Assessment
Volume A-7
Introduction
EA Methods and Study Area
7.1.2
Linkage Diagrams
To show how the answers to the key questions are derived, technical specialists
illustrated their analytic process by developing a “linkage diagram”. Each
linkage diagram depicts the relationships between the project, the information
collected during the baseline program and the issues raised during consultation.
The linkage diagram also shows connections to other key questions or topics.
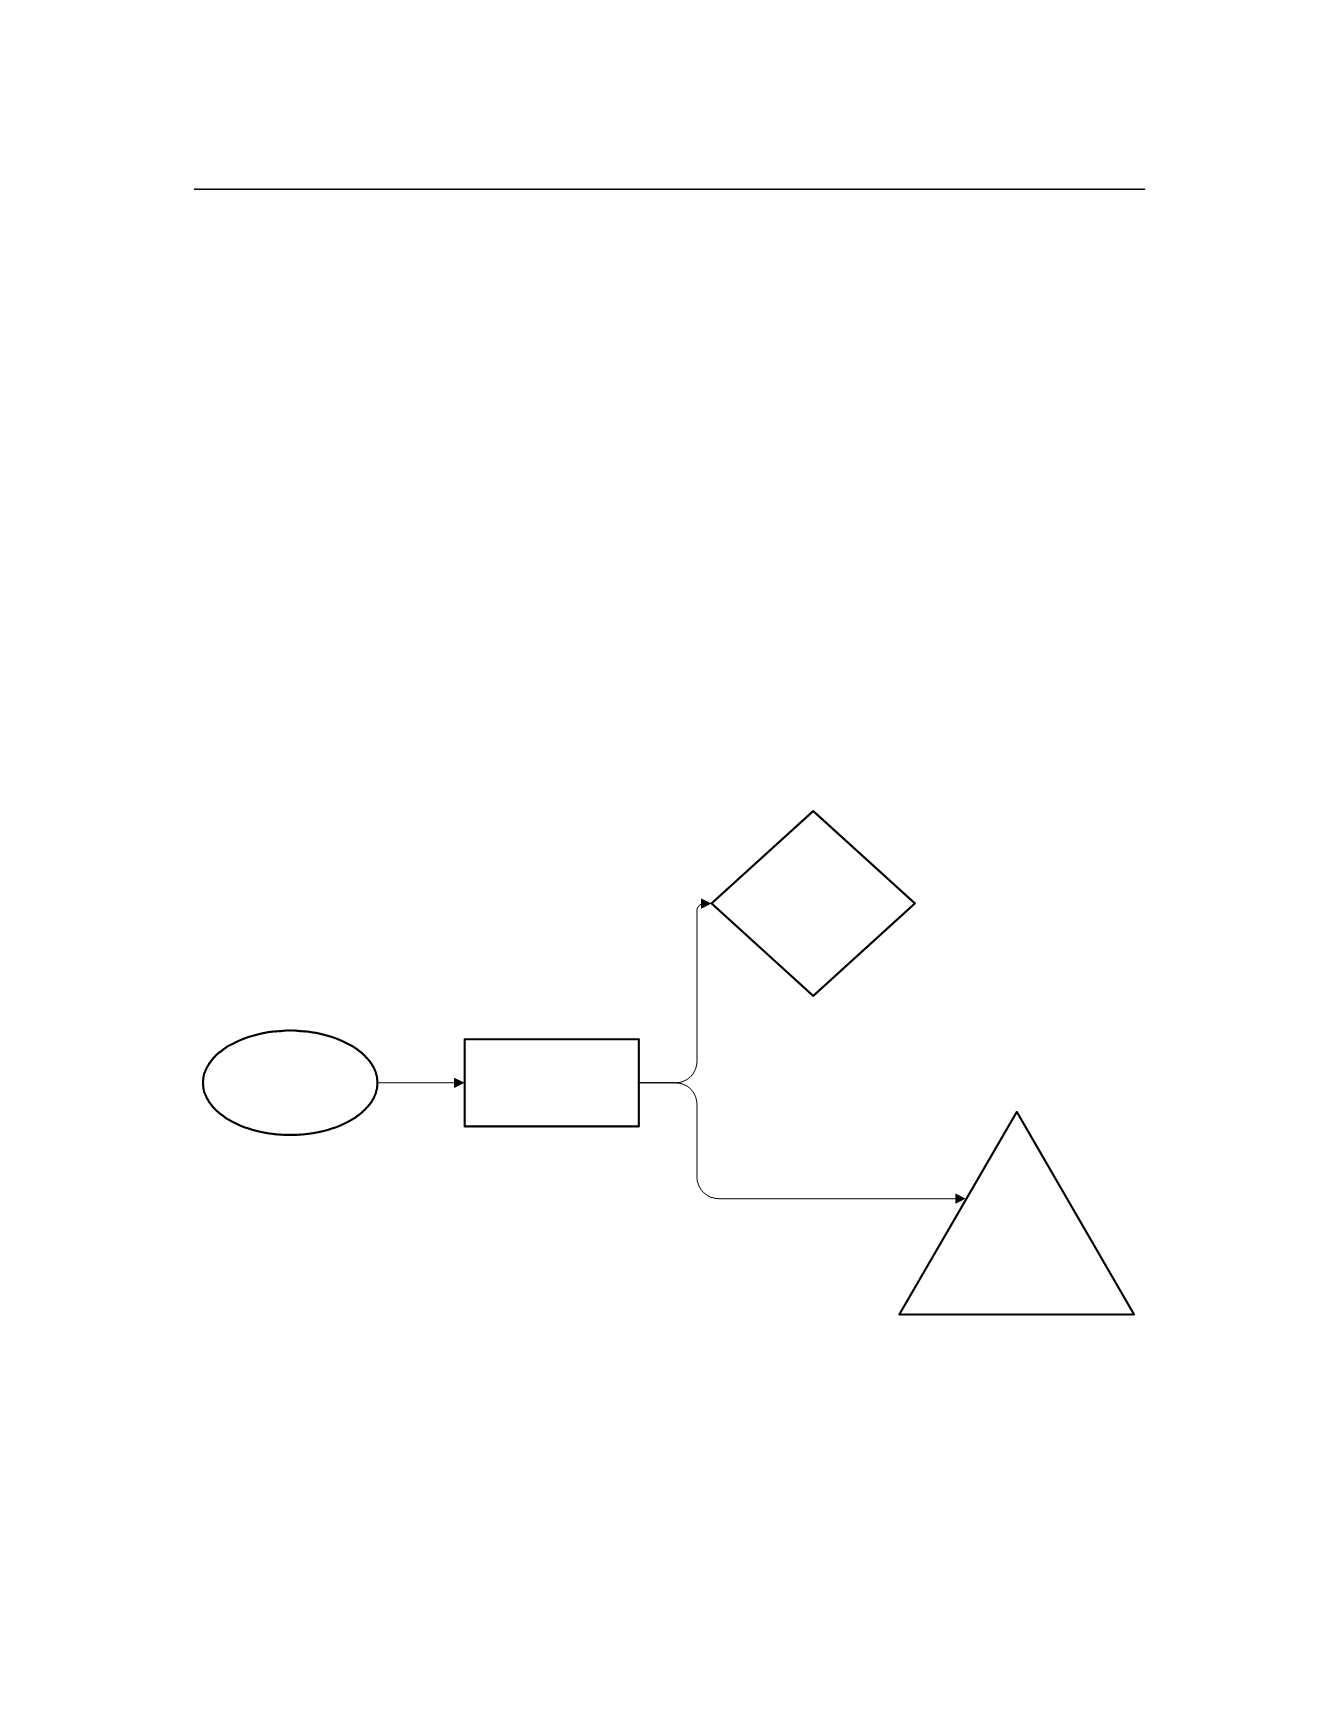
Figure 7.1-1 illustrates the typical format of a linkage diagram. The linkage
diagram assists specialists in their work and enables readers to understand what
has (and has not) been included in the impact analysis.
Figure 7.1-1 Example of a Linkage Diagram
Key Questions
Potential change in
environment (physical
or biological)
Project activity
PROJECT
ACTIVITIES
ENVIRONMENTAL
CHANGES
CONNECTION TO
DIFFERENT TOPIC AREA
KEY
QUESTIONS
Connection
to linkage
diagram
to or from a
different topic
area
Preparation of linkage diagrams requires the following key elements:
•
identify project components that may affect an environmental resource
(illustrated by an oval);
•
predict the environmental changes that may result from the project
(illustrated by a rectangle);
Ambatovy Project
51
January 2006


